
School Metabolic Health Checks
School metabolic health checks are carried out in the context of a wider curriculum programme exploring NCDs in individuals and the community. Here we review the Year 9 student health check data from 2016-2023 to see what information is collected, and how this helps us learn more about our metabolic health.
What is the School Metabolic Health Check?
WHAT
A series of physical measurements to monitor factors associated with the metabolic health of teenagers

WHY
Supports evidence-based health promotion
Meets the demand from teenagers to know more about their health

HOW
School-based checks
Students receive data via My Health Profile booklet
Classroom learning supports understanding
Student Demographics 2016-2023 (n=783)
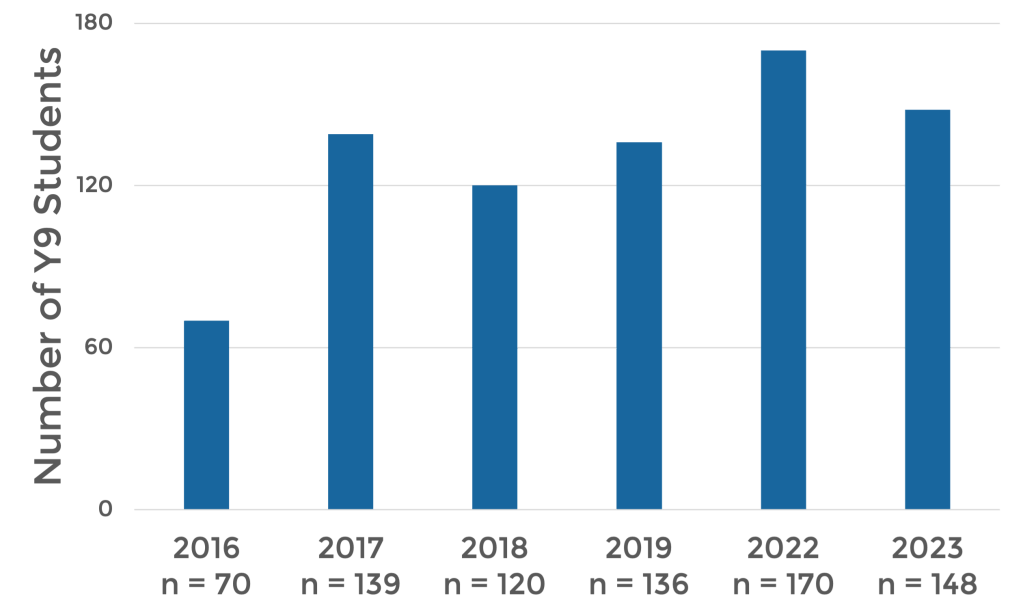
Number of Year 9 students participating each year: all schools
Mean age of students who participated
| School |  Male Male |
 Female Female |
|---|---|---|
| Tereora College | 13.78 | 13.76 |
| Nukutere College | 13.80 | 13.67 |
| Papaaroa School | 13.82 | 14.14 |
| Titikaveka College | 13.60 | 13.43 |
Talking points
There was an overall increasing trend in the number of Y9 student participants from 2016 to 2023 across all schools.
How might the number of students enrolled in Y9 each year impact the number of participants?
The mean age of students who participated was similar in each school, with little difference between males and females.
Is mean the best calculation here for summarising age? What else could we use?
Year 9 female and male students by school

Talking points
Why might there be a difference in the number of female and male participants?
About the Data






Body-Mass-Index
(BMI)
- BMI is a person’s weight in kilograms divided by the square of height in metres.
- BMI is an inexpensive screening tool for weight category.
- BMI does NOT diagnose body fatness or health of an individual.
- BMI is moderately correlated with body composition; it is strongly correlated with metabolic health and disease outcomes such as type 2 diabetes.
- In the Year 11 programme Te Maki Toto Vene (T2): E Manamanata no Toku Iti Tangata students explore BMI in some detail. They learn that tools such as DEXA scans can give more accurate body composition measures, but that BMI is strongly linked to risk of type 2 diabetes.
Body-Mass-Index-for-Age
(BMI-for-Age)
- BMI is age and sex specific.
- Adult BMI IS NOT the same as BMI for children and teens.
- BMI-for-age is an index used for children and teenagers.
- BMI-for-age IS NOT calculated using the standard BMI formula.
- Online calculators like the one below can calculate BMI-for-age by inputting height, weight, sex and age.




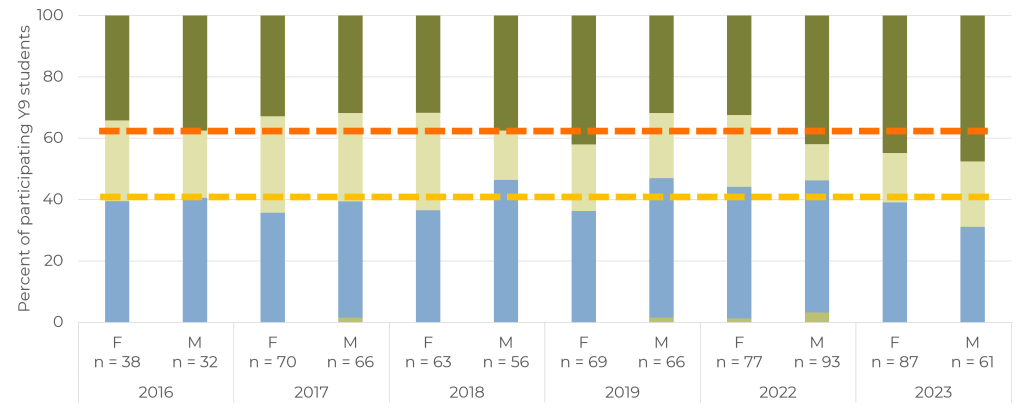
Body-Mass-Index-for-Age: all schools

Talking points
What do you notice? Is there really that much difference between the bars?
For example, there tends to be around 40% of participants, regardless of sex, with BMI-for-Age measurements in the healthy weight category. The group with the highest proportion of underweight measurements are the male students in 2022.
Waist-to-Height Ratio
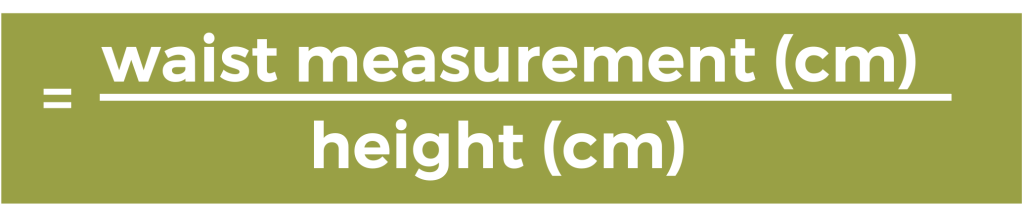
- The waist-to-height ratio is used to find out if a person is carrying extra fat around the middle.
- This type of fat is associated with increased risk of conditions such as type 2 diabetes and heart disease.
- A healthy waist measurement is less than half your height.
- Waist to height ratio is not dependent on sex or age.


Waist-to-Height Ratio: all schools

Talking points
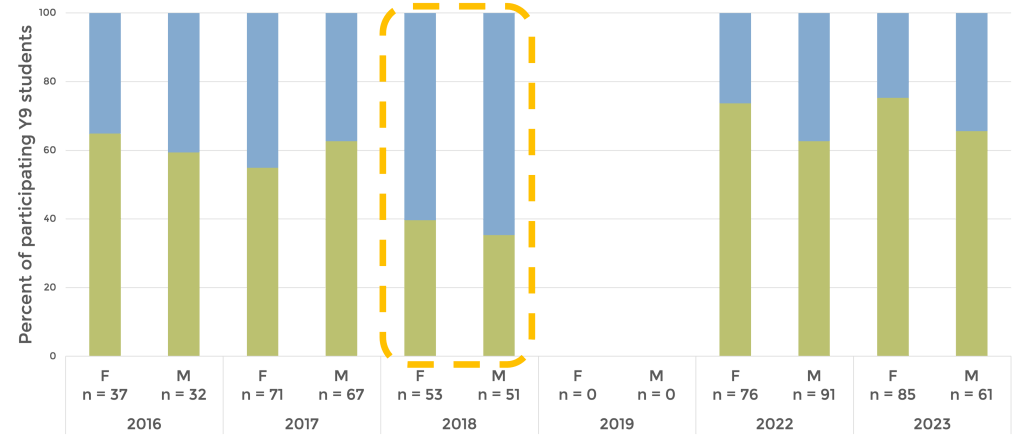
This is another stacked bar graph, separated by study year and then further split into female and male groups.
What proportion of participating Y9 students had WtHR measurements that fell in the low risk category?
There are two unusual study years; 2018 and 2019. In 2019, WtHR was not measured.
So, what might have happened in 2018 for the proportion of low risk measurements to be so low compared to other study years? Do you think this is accurate?)
Blood Pressure (BP)
- The pressure created by blood in the circulatory system against the walls of the blood vessels is known as blood pressure (BP).
- When the heart pumps blood into the arteries the pressure increases.
- Blood pressure is written as:
systolic / diastolic e.g., 120 / 80 - For children and teenagers, blood pressure categorisation depends on:
- Age
- Height
- Sex

Blood Pressure Calculator

Blood Pressure: all schools
Talking points
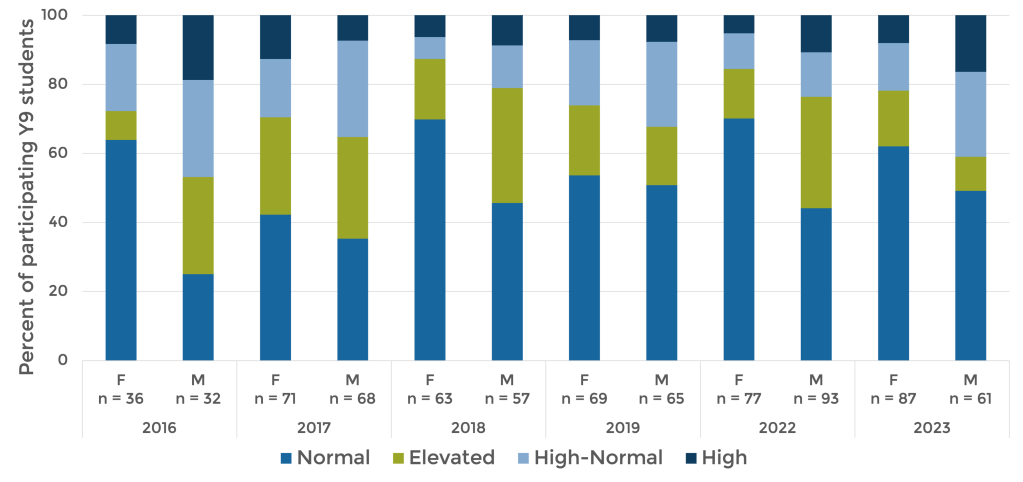
Who tends to have a higher proportion of normal blood pressure measurements, females or males? What about for high blood pressure?
It is a little difficult to spot any patterns in this data!
What might impact a participant’s blood pressure?
Cholesterol
- Cholesterol is a waxy fat-like substance in blood.
- Humans need cholesterol build healthy cells.
- The human body can make cholesterol, and we can eat foods that have cholesterol.
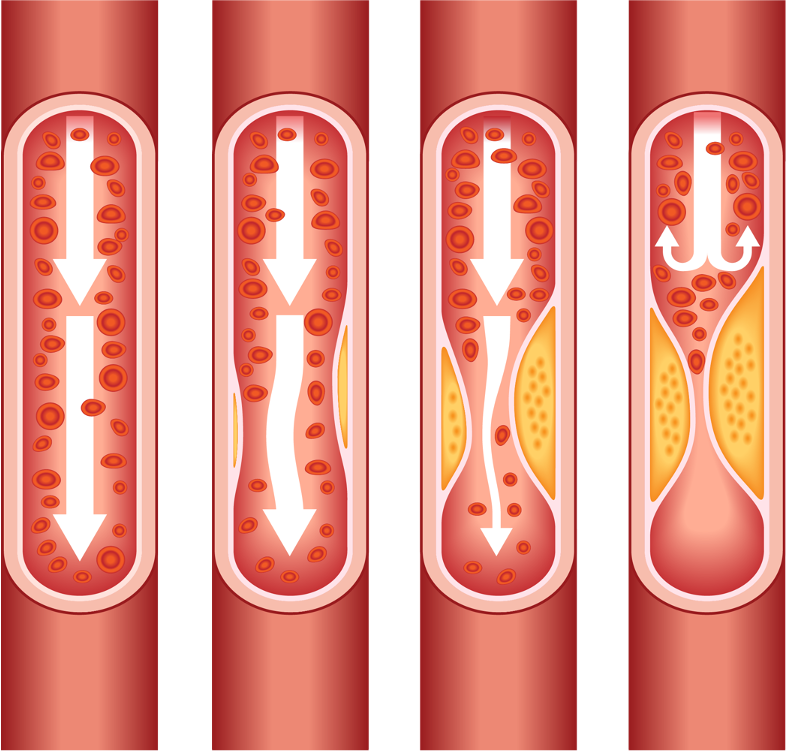
- When there is too much cholesterol in the blood it combines with other substances to form plaques that stick to the walls of the arteries.
- These plaques can grow and make it difficult for blood to flow and increasing blood pressure.
- Sometimes plaques break off and form clots, causing heart attacks and stroke.
Good vs Bad Cholesterol
- LDL (low density lipoprotein) is bad cholesterol.
- LDL cholesterol contributes to plaques.
- Foods such as dairy, fried foods, red meats, butter have a lot of LDL.

- HDL (high density lipoprotein) is good cholesterol.
- HDL cholesterol can protect against heart attacks and stroke by mopping up cholesterol and taking it to the liver where it can be processed and released from the body.
- Foods such as nuts, beans, avocado, oily fish, legumes and high fibre fruits will boost HDL.
Factors associated with raised cholesterol include:
- High-fat diet
- Low levels of daily exercise
- Being overweight or obese
- Smoking
- Drinking too much alcohol
- Genetics – high cholesterol levels can be inherited
Total Blood Cholesterol: all schools


Talking points
Who tends to have a higher proportion of raised cholesterol measurements, females or males?
Blood Sugar Level
- Also known as blood glucose level.
- Blood Sugar Level refers to the amount of sugar (glucose) present in the blood.
- Glucose is a type of sugar that comes from the food we eat and is our body’s main source of energy.
- When we eat, food is broken down into sugars (glucose). Insulin is an important hormone that helps move the glucose to cells where it is used.
- Diabetes is a condition that occurs when blood glucose levels rise higher than they should. This happens either because the body cannot make insulin or because your body cannot use the insulin it is making.
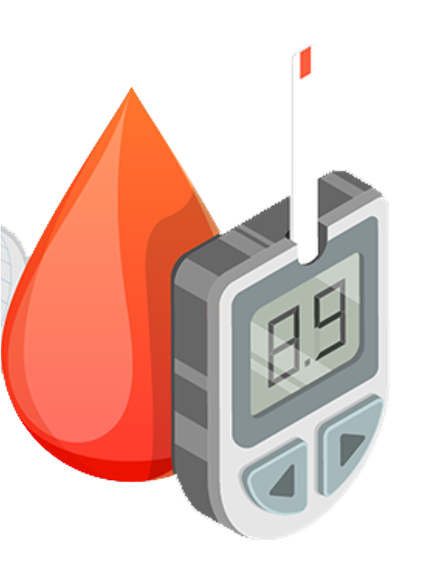
 Ideally, a Blood Sugar Level measurement should be taken when one has fasted (not eaten for 8 hours) before the test.
Blood Sugar Level: all schools


Talking points
What does that mean for how we interpret this graph?
« Metabolic health main page
Ko‘ai Mātou | About Us
Learn more about our work, partnerships and engagement
Tua Tāpapa | Our History
Discover the milestones and story behind our journey
Te Aronga ‘Anga‘anga | Our People
Meet our team